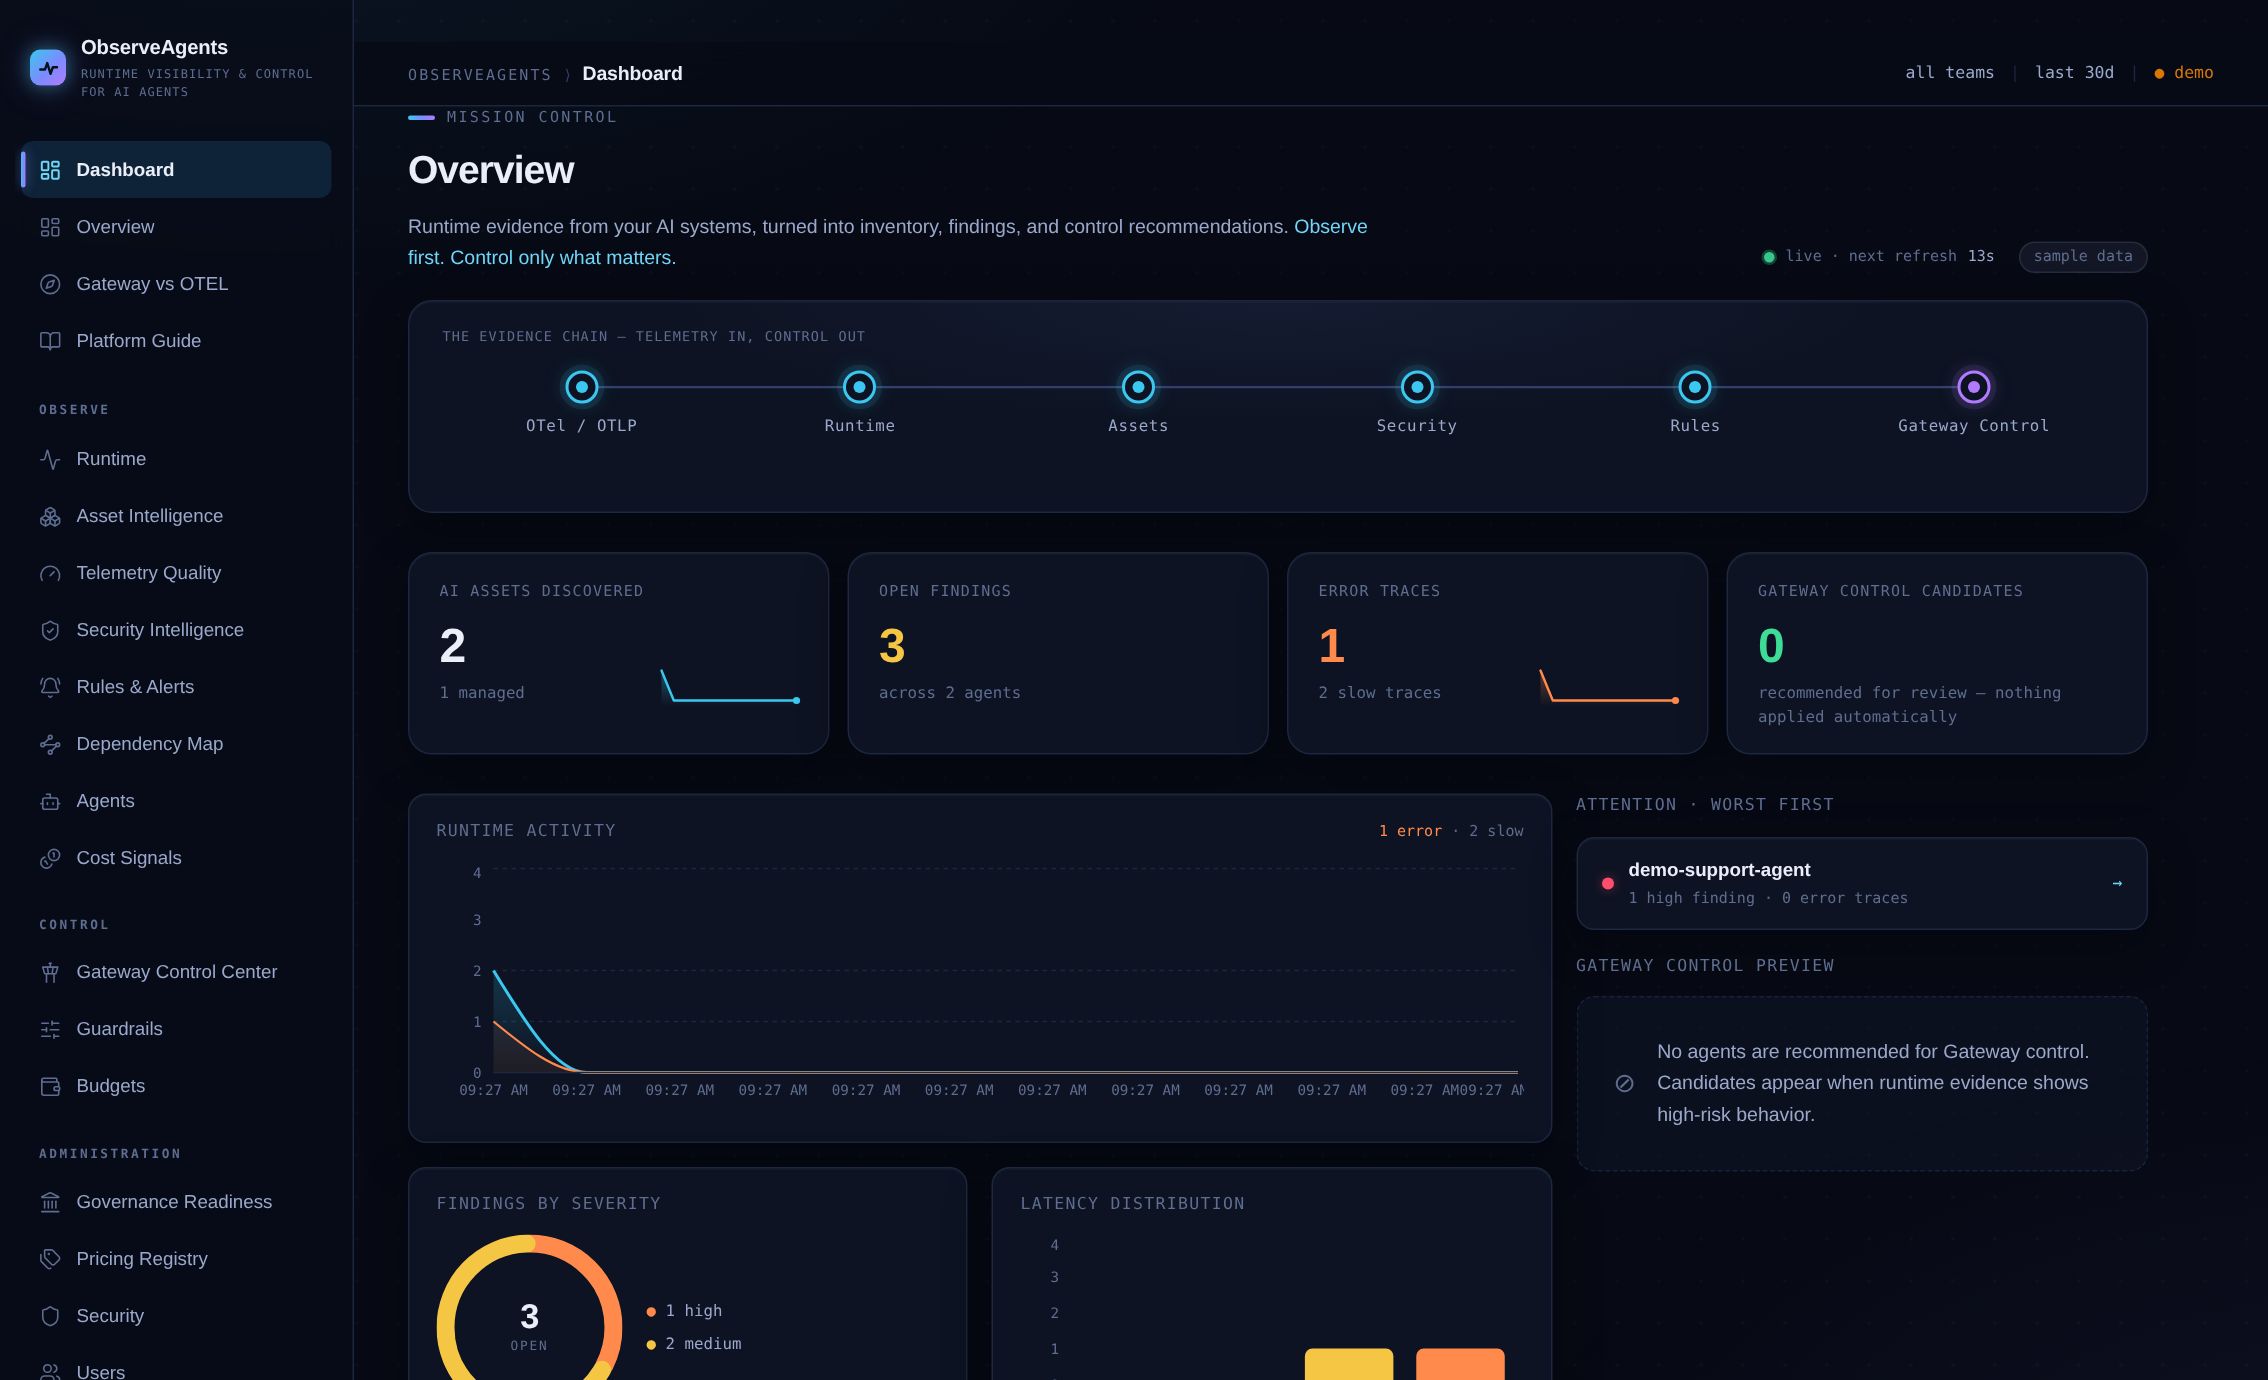
Install AI runtime instrumentation
Add OpenTelemetry-compatible instrumentation such as OpenLLMetry, OpenLit, OpenInference, or manual OTel spans.
Your applications send metadata about what happened: which agent ran, which model it used, which tools were invoked, which databases and APIs were reached, how long it took, and whether errors occurred. ObserveAgents turns that evidence into an AI inventory, a dependency map, a capability map, and findings.
Add OpenTelemetry-compatible instrumentation such as OpenLLMetry, OpenLit, OpenInference, or manual OTel spans.
Send traces to ObserveAgents using the standard OTLP endpoint.
ObserveAgents identifies running agents from service.name, gen_ai attributes, tool calls, MCP calls, providers, models, and runtime behavior.
The platform maps each agent's tools, MCP usage, APIs, databases, providers, errors, owners, and environments.
Detection Rules identify patterns such as high MCP usage, repeated tool errors, unknown providers in production, DB/API access, and missing ownership.
High-risk agents are surfaced in Gateway Control Center for review and optional control planning.
Try the live demo first — runtime timelines, the inventory, findings, and the Gateway Control Center on realistic synthetic data. Then connect your own OTel stack in an afternoon.
Try our Demo →