01
Log-diving
Grep five services and stitch timestamps by hand — for every flaky agent run, again and again.
Retries, silent tool errors, latency stacked across steps. ObserveAgents takes the OpenTelemetry traces you already emit and turns every agent session into an execution waterfall — no proprietary SDK, no re-instrumentation.
An agent request fans out across models, tools, MCP servers, and databases. When it's slow or wrong, the story is spread over five systems and none of them agree. Reproducing it locally is a fantasy.
Point an OTLP exporter at ObserveAgents. Sessions, waterfalls, inventory, and alerts appear — no manual registration, no tagging.
Works with the OpenTelemetry SDKs and collectors you already run, speaking the GenAI semantic conventions.
Traces grouped one row per agent session, expandable into per-step timing — where every request actually spent its time.
See which services classify fully, which signals are missing, and which custom attributes deserve a mapping.
Every MCP server, tool, API, and database your agents touch at runtime — discovered, not declared.
Built-in detection rules over runtime behavior — repeated tool errors, MCP thresholds — delivered to your webhook.
Ingest. Correlate. Alert. On the pipeline you already own.
POST /otel/v1/traces from your existing stack. Agents and their sessions appear without registration.
One row per agent session, expandable to per-step timing, tool calls, token usage, and errors.
Threshold rules evaluate during intelligence runs — never inside ingestion — and reach you by webhook.
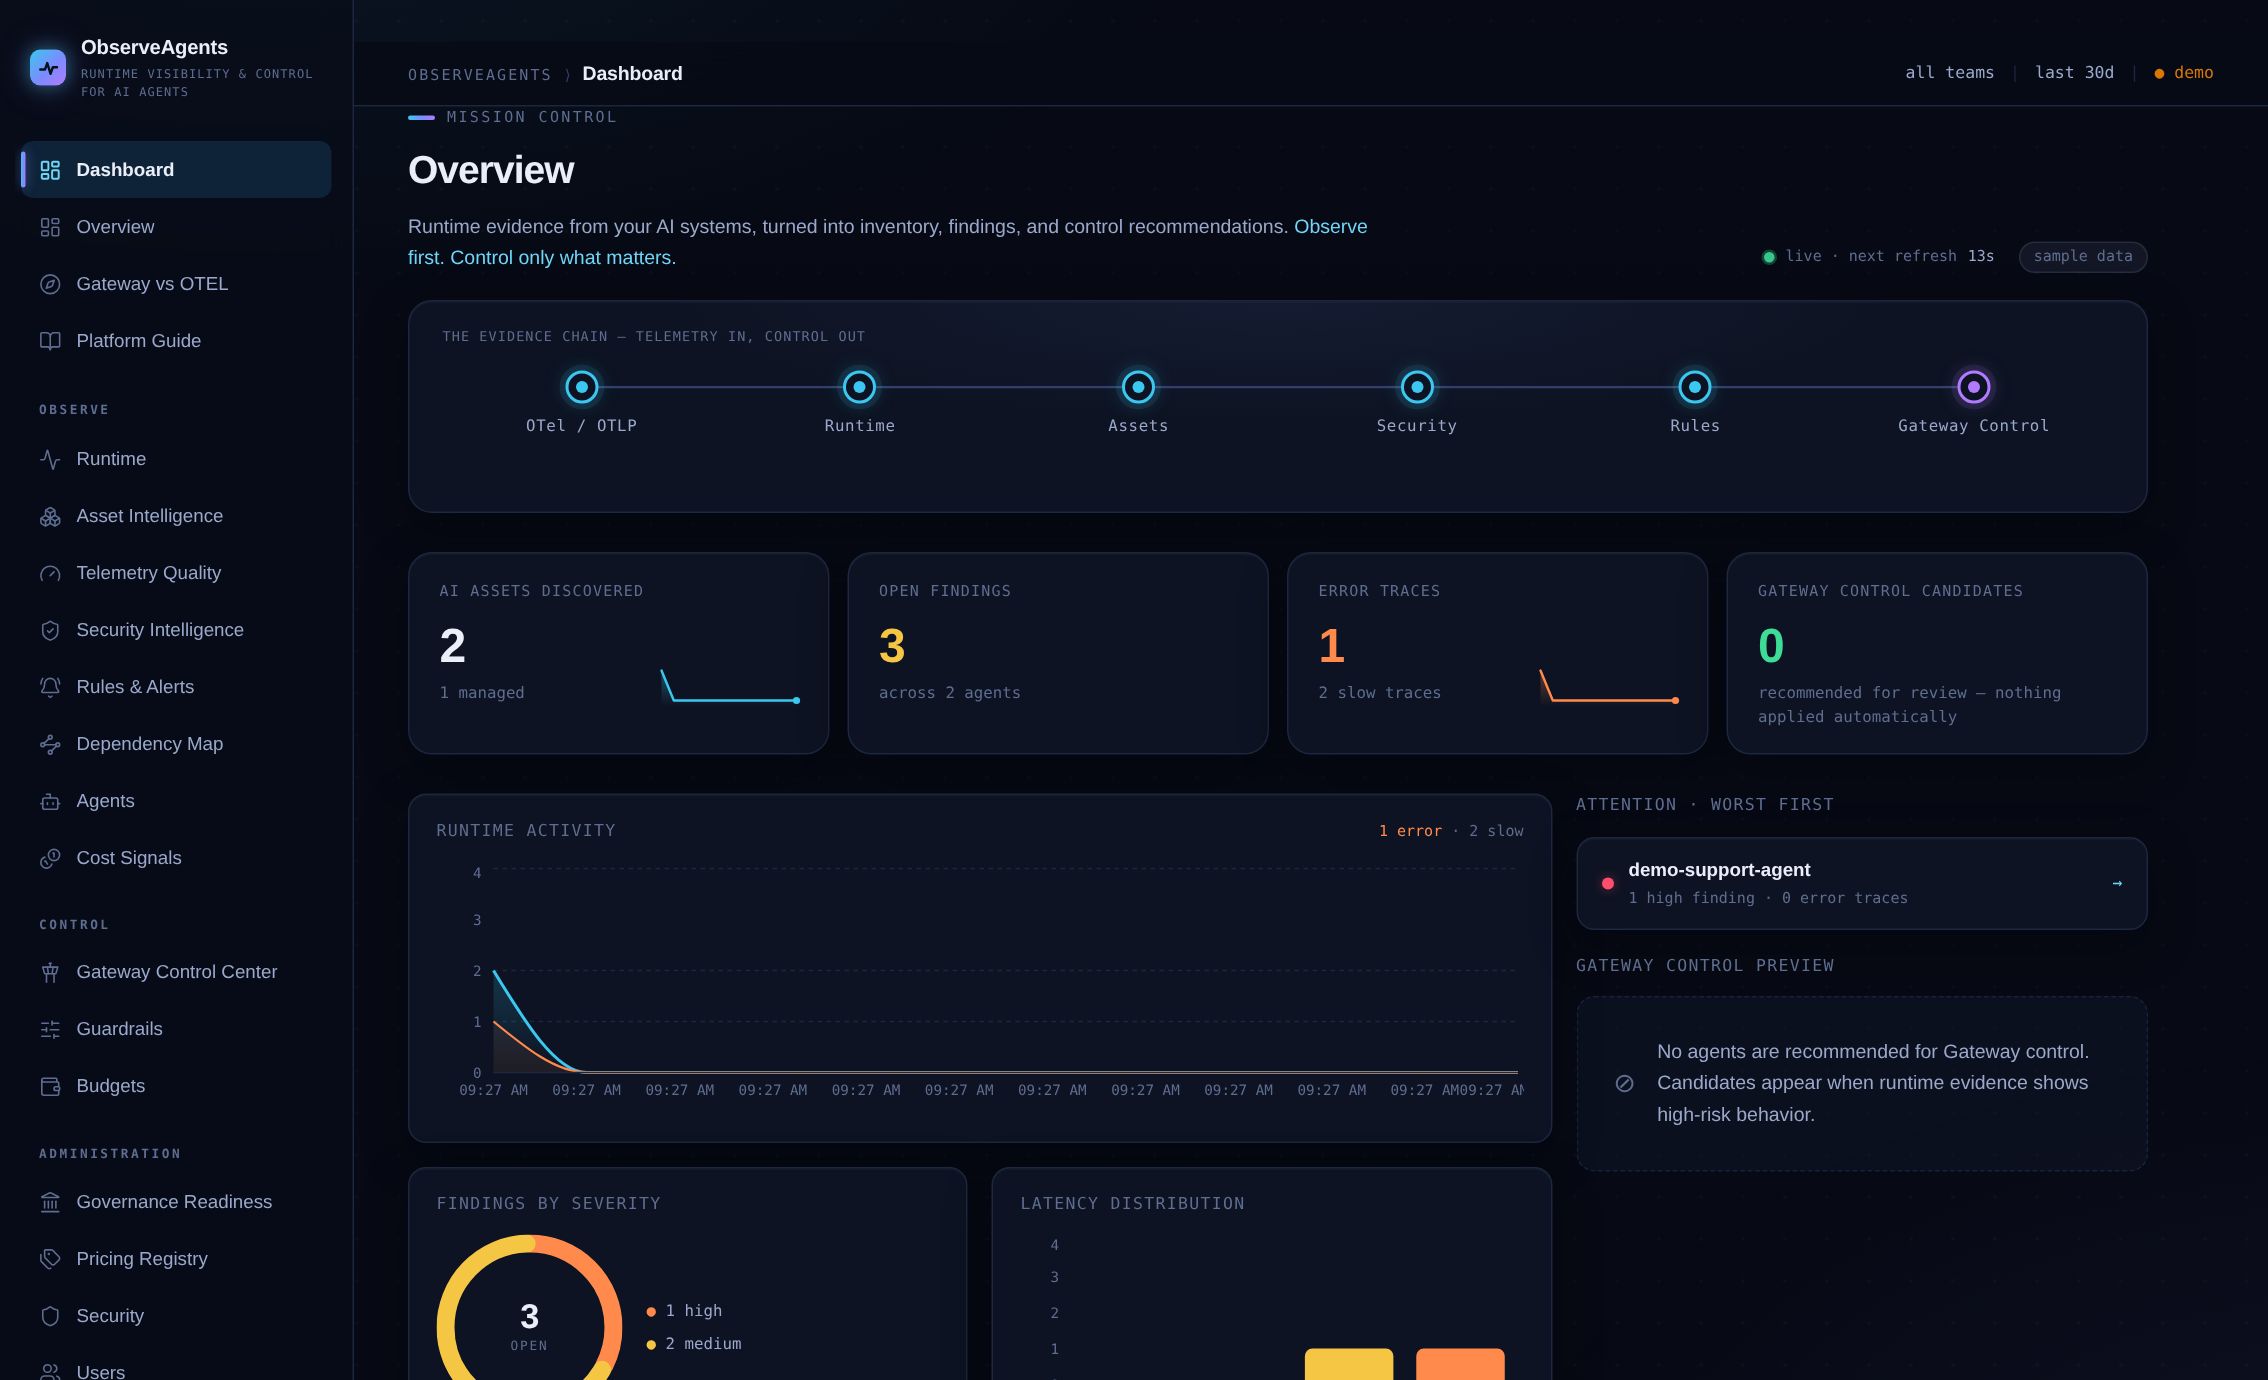
Open the live demo: runtime timelines, execution waterfalls, telemetry quality, and the dependency map — on realistic synthetic data.
Try our Demo →